How to Use Google Ads Auction Insights and Rank Higher
Sanja Trajcheva
|Marketing | July 01, 2023

Wondering how your Google Ads campaign is stacking up against the competition? Maybe you want to know how your keywords perform versus your competitors’ bids or who is bidding on your brand keywords.
That’s exactly why you’ll want to take a look at the auction insight reporting tool for Google Ads. This treasure trove of information can help you adjust your bids and work out areas you need to improve to rank higher.
Let’s take a closer look at the Auction Insights report on Google Ads and how it works.
What is Auction Insights for Google Ads?
The Auction Insights report is a downloadable data sheet that shows how your keyword bids have performed in real-time bidding auctions. It lets you compare the performance of your individual keywords and ad campaigns against anyone else in those auctions.
The theory is that you can see where your ads are performing and where they are falling short – and by how much. You can even see where your ads have tied with a competitor and whether your ad came out on top or not.
Auction Insights is available for:
- Google paid search
- Google Shopping
- Performance Max campaigns
You can then access six unique statistics related to the ad performance. These are:
- Impression share
- Overlap rate
- Outranking share
- Position above rate (Search campaigns only)
- Top-of-page rate (Search campaigns only)
- Absolute top-of-page rate (Search campaigns only)
How to access the auction insight report
Your auction insights report can be generated for the Google Ads campaigns that meet the minimum threshold for activity. What is the minimum threshold? Well, no one actually says, but based on other requirements for audience analysis, at least 1000 visitors within the past 30 days will be about sufficient.
To access the data, you obviously need to login to your Google Ads account.
You can then access data based on:
- Campaigns
- Search keywords
- Ad groups
Choose the page for the data you want to analyze. Once inside, you’ll be presented with a list of available campaigns, keywords, or ad groups. Click the tick boxes for the ones you want to view.
Click on the Auction Insights button, and you’ll be taken to the report.
If you have selected only search or shopping campaigns, then you’ll have the data available right there. If you’ve selected a mix of search and shopping results, then you’ll need to hit the corresponding radio button to switch between pages.
You can then, of course, filter your results.
How to read your auction insights data
So you’ve accessed the auction insights report, downloaded your data, and now you’re wondering what it all means.
Impression share
Impression share is calculated by working out the actual total of impressions against the potential total that was available. So, for example, if your ad received 1000 impressions from a potential total of 10,000 then you’d have an impression share of 10%.
Overlap rate
If your competitor’s ad receives an impression at the same time as your ad then this is an overlap. The overlap rate measures how often your competitor’s ads were shown at the same time as yours. So for 20%, your competitor’s ads showed two times in every ten impressions.
Outranking share
As you might have guessed, this is the amount of times your ad outranked a competitor. And, of course, it also highlights the amount of times your competitors might have outranked you…
Position above rate (search only)
Similar to outranking share, this percentage explains how often your competitor’s ad appeared above you in head-to-head bids. And as stated, this can only be shown for paid search campaigns.
Top of page rate (search only)
Another self-explanatory metric, the top-of-page rate, highlights how often your ad appeared at the top of the paid search rankings.
Absolute top-of-page rate (search only)
Similar to the top-of-page rate, the absolute top-of-page rate refers to how often your ad is displayed at the top of the page as the very first ad.
What can you do with auction insight data?
Now, you can see how your ads are performing, and the data might serve as a useful starting point for a PPC audit. Can you adjust your bids or up your ad spend? Do you need to work on your quality score?
Google’s own recommendations for improving your search results and getting your ad ranked higher include the following:
- Increasing your ad campaign budgets
- Adjusting your keyword bids
- Focusing on improving your quality score
- Adjust targeting
And, of course, with the insight from the auction insight reports, you can see how these changes need to be enabled.
What isn’t shown in Google Ads insight data?
One thing you won’t see in your auction insights reports is data about invalid traffic. Often referred to as click fraud or ad fraud, invalid traffic is any form of non-genuine traffic clicking or viewing your paid ads.
You can actually view your invalid traffic, or IVT rate, in your Google Ads dashboard.
Google Ads normally picks up between 1-3% of clicks as invalid. However, by using our own fraud filters, an average of 14% of all clicks on paid search ads come from bots, competitor clicks, or other non-genuine sources.
Find out more in our complete guide to click fraud.
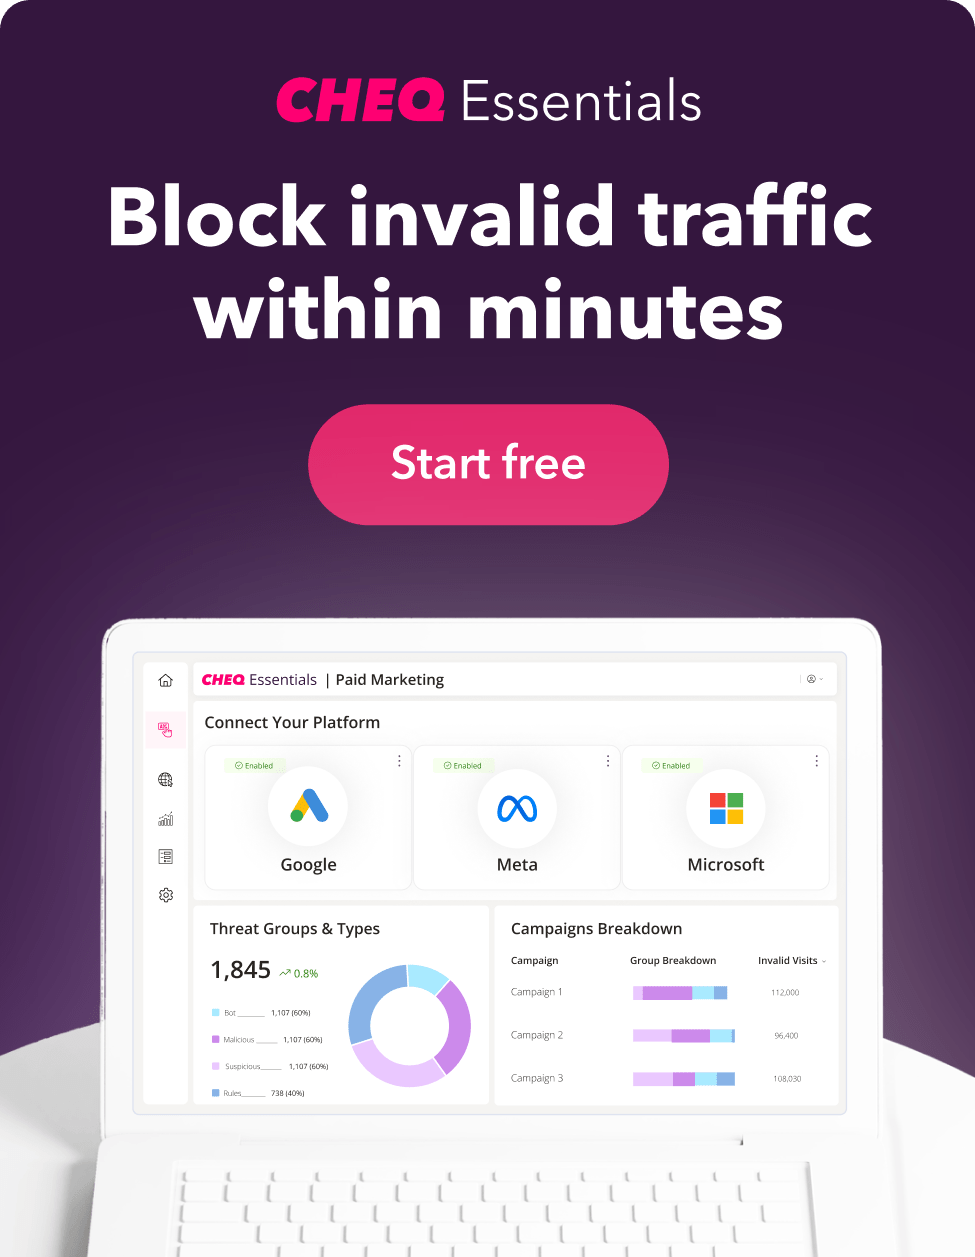
If you’re running Google Ads for your own business or on behalf of your clients, you can perform your own auction insights using CHEQ Essentials.
CHEQ Essentials will highlight fake traffic, including fraud from sources such as VPNs or outside of geo-location, fraud by specific keywords, and much more.

Author
Sanja Trajcheva
As an experienced content writer, Sanja is a firm believer in the power of storytelling to inspire and educate audiences. In her role at CHEQ, Sanja fearlessly tackles the challenges of the fake web – navigating through fake traffic, ad fraud, and click fraud. When not writing, she enjoys exploring new tastes and planning her next adventures.